Monitoring #
Monitoring is essential for ensuring Forwarder’s health, performance, and resource utilization. This document provides a guide on how to collect Prometheus metrics, and setup Grafana.
Dashboard #
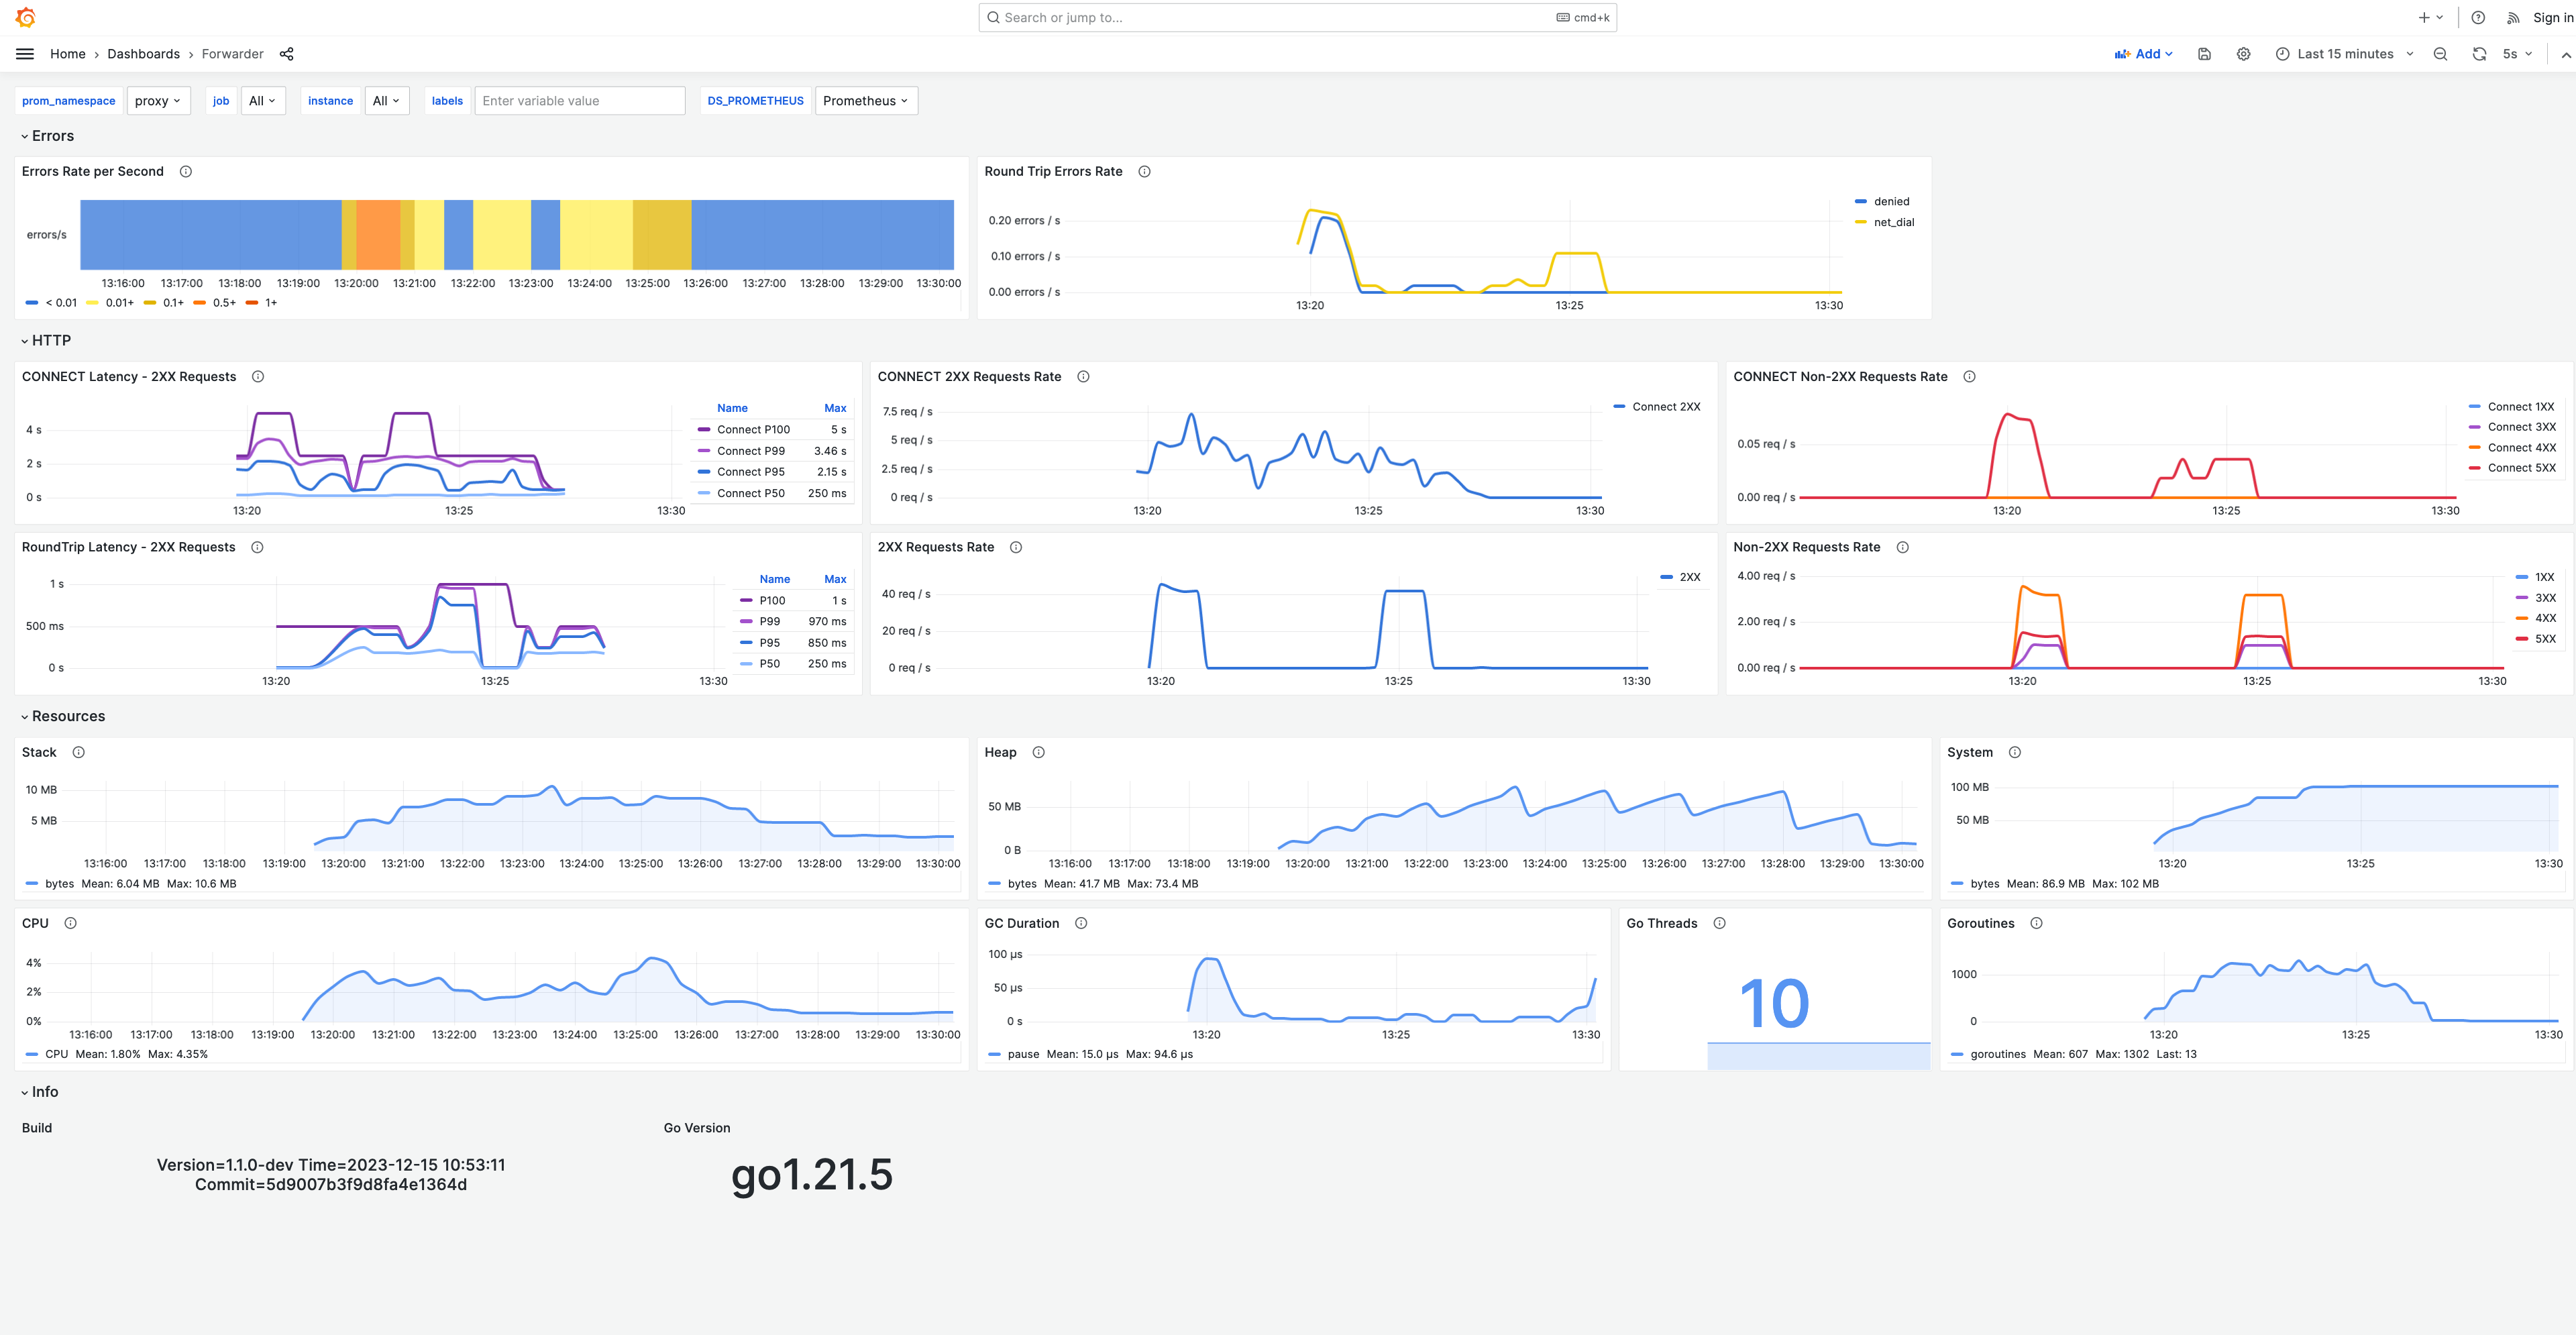
The Forwarder dashboard provides a high-level overview of health and performance. It consists of the following sections:
- Errors - general information about the Forwarder health
- HTTP - HTTP traffic metrics
- Resources - memory, CPU, and golang runtime metrics
- Info - version information and build details
Dashboard is available in Grafana dashboards registry. You can also use the source code version from here.
Import Dashboard from Grafana Registry #
If you are familiar with Prometheus and Grafana stack, you can import the dashboard with the following steps:
- Click Dashboards in the left-side menu.
- Click New and select Import in the dropdown menu.
- Perform one of the following steps:
- Paste a Grafana dashboard ID
20100and click Load. - Paste dashboard JSON text from here directly into the text area.
- Paste a Grafana dashboard ID
Step-by-Step Installation #
Forwarder exposes Prometheus metrics in the API server on the /metrics endpoint.
The API server listens on localhost:10000 by default. This port will be used in the following steps.
Configure Prometheus #
- Install and start Prometheus following this guide.
- Configure Prometheus to scrape metrics from your Forwarder:
- Open your Prometheus configuration file (usually
prometheus.yml). - Add a new job to the
scrape_configssection:
- Open your Prometheus configuration file (usually
scrape_configs:
- job_name: 'forwarder'
  scrape_interval: 15s
  static_configs:
    - targets: ['localhost:10000']
Configure Grafana #
- Install and start Grafana following this guide.
- Add Prometheus as a data source:
- Go to
Settings>Data Sources. - Click
Add your first data source. - Choose Prometheus and configure the URL (e.g.,
http://localhost:9090).
- Go to
- Import Dashboard from Grafana Registry:
- Go to the Grafana Dashboard.
- Click on the
Newor+icon selectImport. - Type the following ID to import the dashboard:
20100.
Congratulations! You have successfully set up monitoring for your Forwarder using Prometheus and Grafana. Adjust the configuration parameters as needed based on your specific setup.
Automatic Local Setup #
We have provided a local monitoring setup that you can use to try out the monitoring features of the Forwarder. All you need is a Docker to run Prometheus, Grafana and Forwarder. See local/monitoring for more details.